
Audit analytics on supplier payments: Bristol supplier spend review
This project analyzes public supplier payment data from Bristol City Council to build an audit analytics workflow around supplier spend, repeated payment patterns, and risk-based review.
The dataset includes three monthly files of payments over £500 and is especially useful for an accounting and audit-focused project because it contains fields such as supplier name, amount, payment date, transaction number, and spending category descriptions.
Source: data.gov.uk — Local authority spend over £500: Bristol City Council
Repository: github.com/FlaviaRossi/data-projects/tree/main/bristol-supplier-spend
Dataset scope
After cleaning malformed and out-of-period rows, the working dataset includes:
- 17,959 payment rows
- 3 months of data
- 1,900 suppliers
- 14,698 transaction numbers
- £189.5M in total analyzed spend
What the review focused on
The analysis was designed around a set of useful audit questions:
- Which suppliers concentrate the largest share of total spend?
- Which spending categories dominate the dataset?
- Which repeated payment patterns should be reviewed?
- Which transactions look unusual relative to each supplier’s normal behavior?
- Can an explainable risk score help prioritize review work?
1. Spend concentration by supplier
Supplier concentration is one of the clearest starting points in a review like this.
Key findings:
- the top 10 suppliers account for about 21.96% of total spend
- the top 25 suppliers account for about 35.25% of total spend
This is useful because concentration risk often matters even when individual transactions are valid. A small number of suppliers can drive a large share of exposure, operational dependence, or review effort.
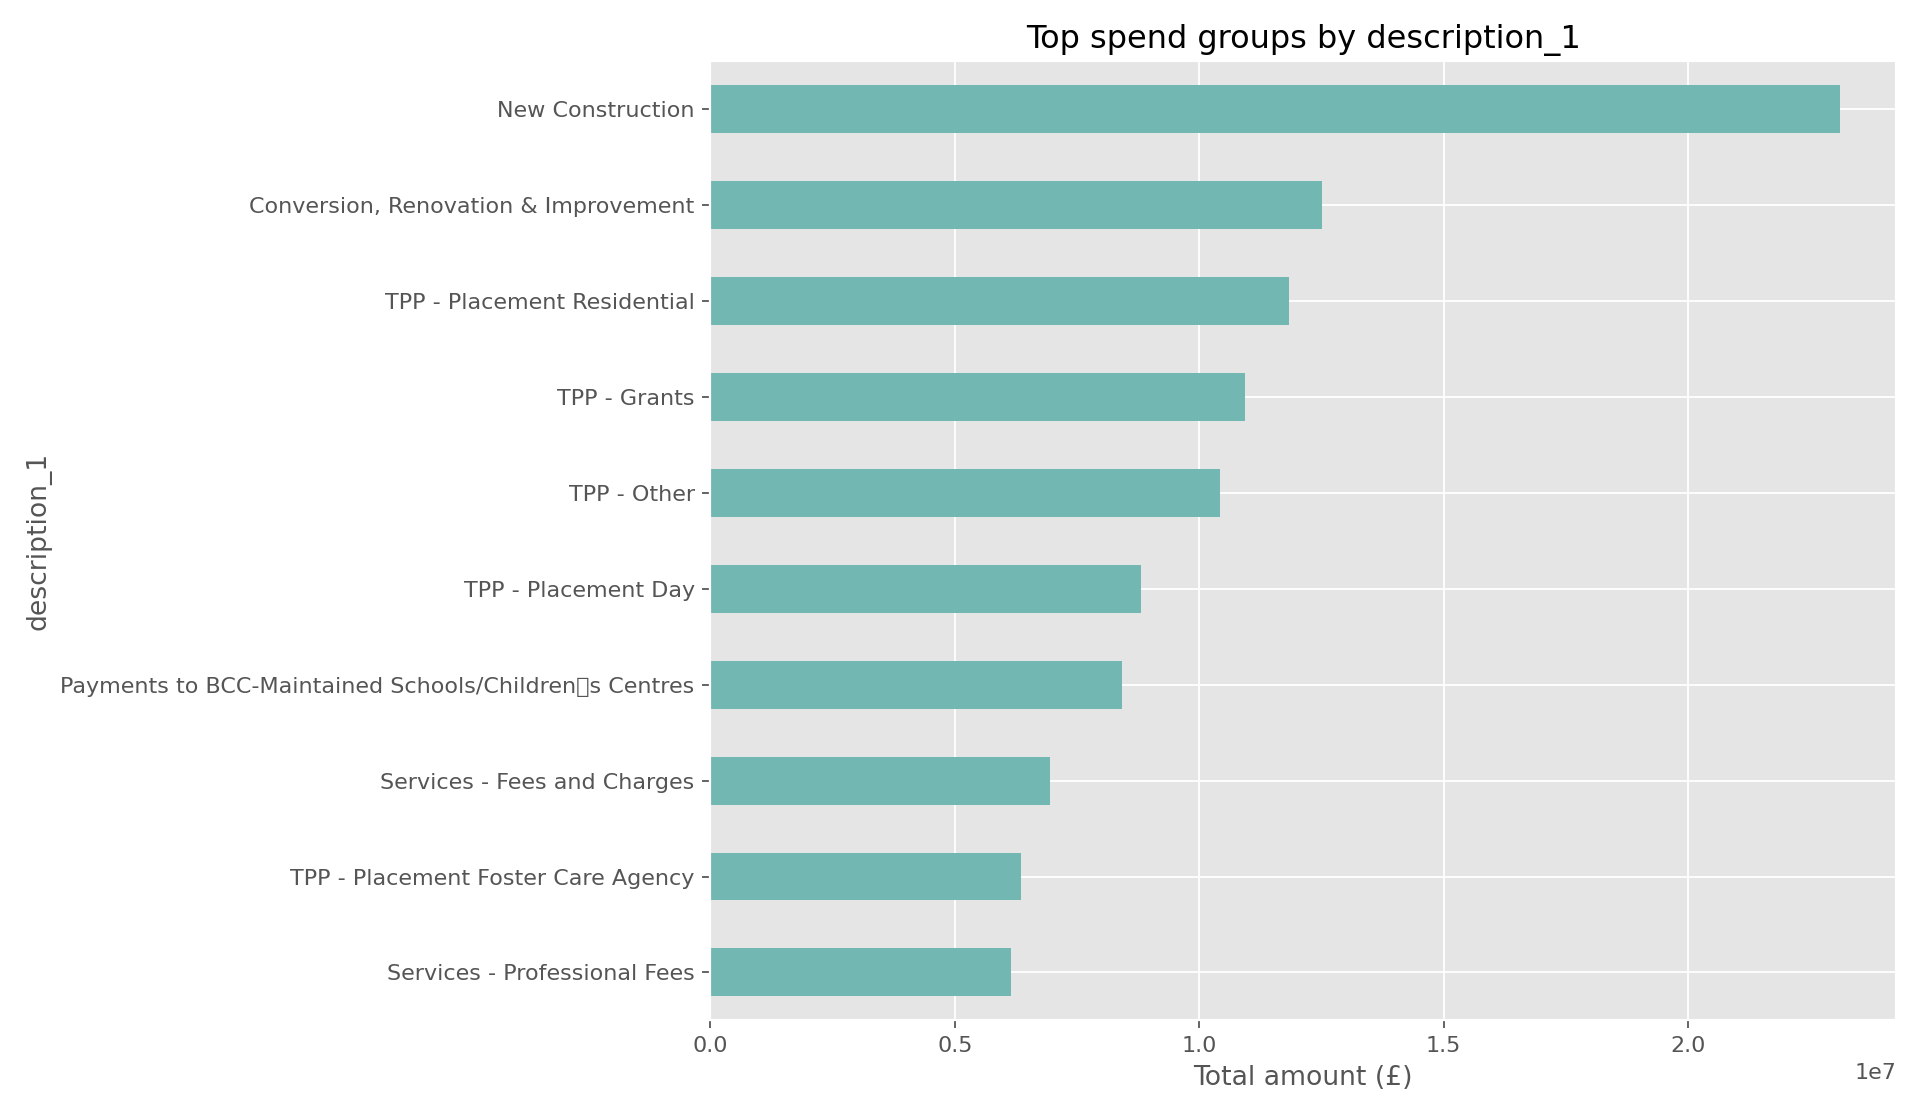
2. Spend categories and program patterns
The description_1 and description_2 fields provide a workable view of spend categories, programs, or departmental activity.
Among the largest groups by amount were:
- New Construction
- Conversion, Renovation & Improvement
- TPP - Placement Residential
- TPP - Grants
- Services - Fees and Charges
- TPP - Placement Foster Care Agency
This helps frame the project not just as payment analysis, but as a category-level review of where resources are concentrated.
3. Repeated payment patterns
Repeated values are not evidence of error by themselves, but they are very useful review candidates.
The analysis found:
- 1,147 groups with the same supplier + amount + payment date
- 4,152 rows inside those repeated groups
- 925 groups with the same transaction number + supplier
- 4,186 rows inside those groups
In practice, these patterns may reflect:
- valid recurring payments
- split lines under one process
- payment batches
- or cases worth a closer look for duplicate or fragmented payment review
4. Supplier-relative outliers
Looking only at the largest payments in the full dataset is not enough. A more useful audit view compares each transaction to the normal pattern of that supplier.
This approach surfaced notable outliers in suppliers such as:
- Jeff Way Construction Ltd
- Maples
- Oasis Support Ltd
- Constellia Public Limited
- REDACTED
This is a strong example of why supplier-relative analytics can add more value than global ranking alone.
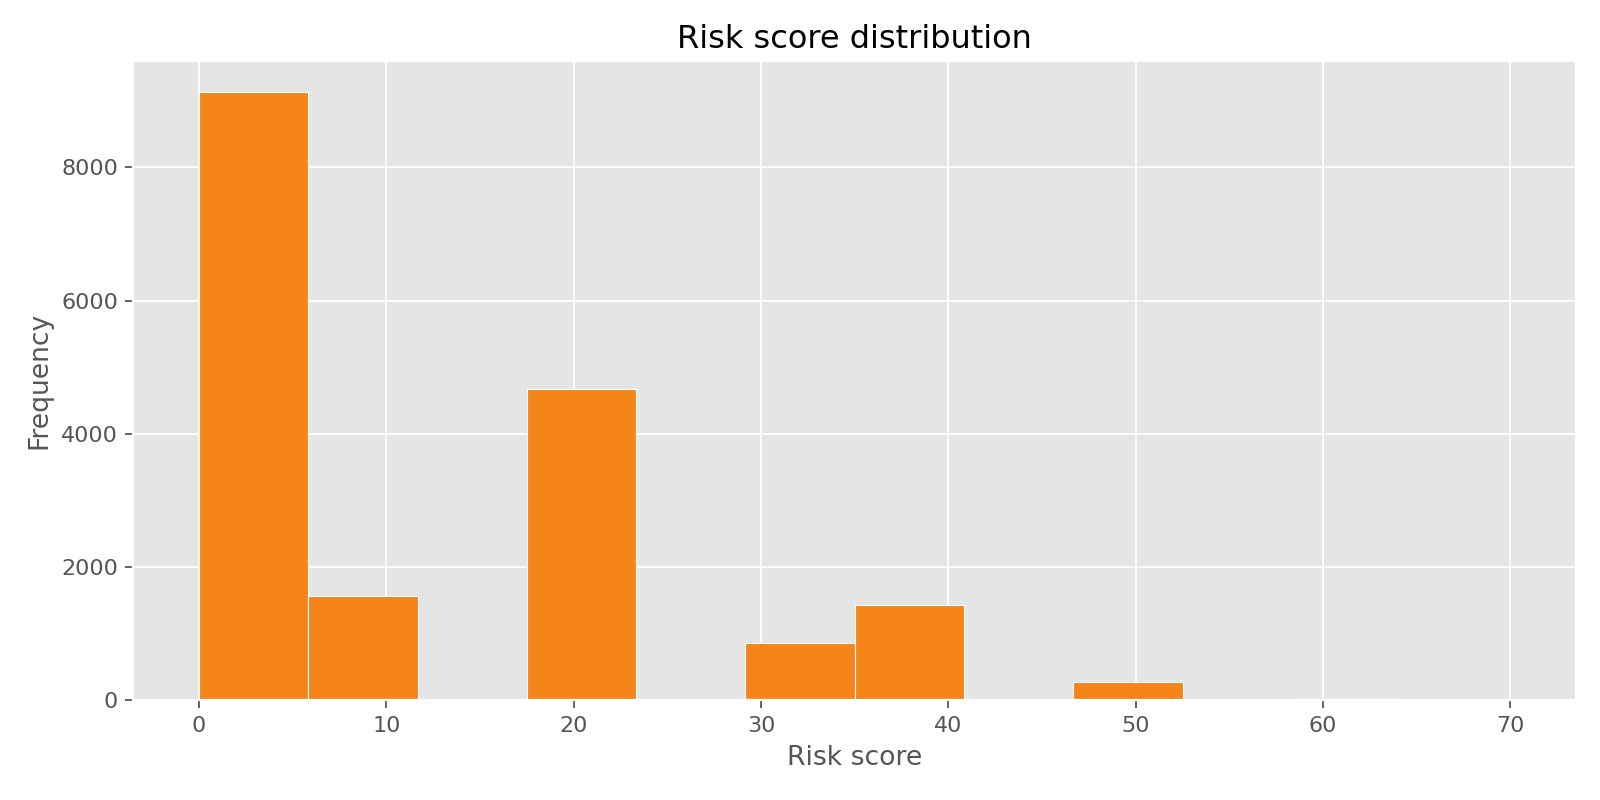
5. Review prioritization with a risk score
A rules-based score was built to create a review queue. The scoring considered flags such as:
- very large absolute amounts
- unusually large amounts relative to supplier history
- repeated supplier + amount + date combinations
- repeated transaction number + supplier combinations
- month-end timing
- redacted supplier names
This produced a small high-priority review set:
- 36 rows with risk score >= 60
- around 0.2% of the cleaned dataset
That is useful because it creates a manageable set of transactions for deeper review instead of applying the same attention to every row.
Why this project matters
This project is a good example of how data analytics can support audit and accounting work in a practical way. It does not depend on a complex black-box model. Instead, it combines:
- real public data
- clear cleaning logic
- supplier and category analysis
- repeated payment checks
- outlier detection
- explainable risk prioritization
That makes it well aligned with audit-oriented work where traceability, interpretability, and reviewability matter.